The Only Instagram KPIs You Need to Track in 2026

What Are Instagram KPIs and Why Do They Matter in 2026?
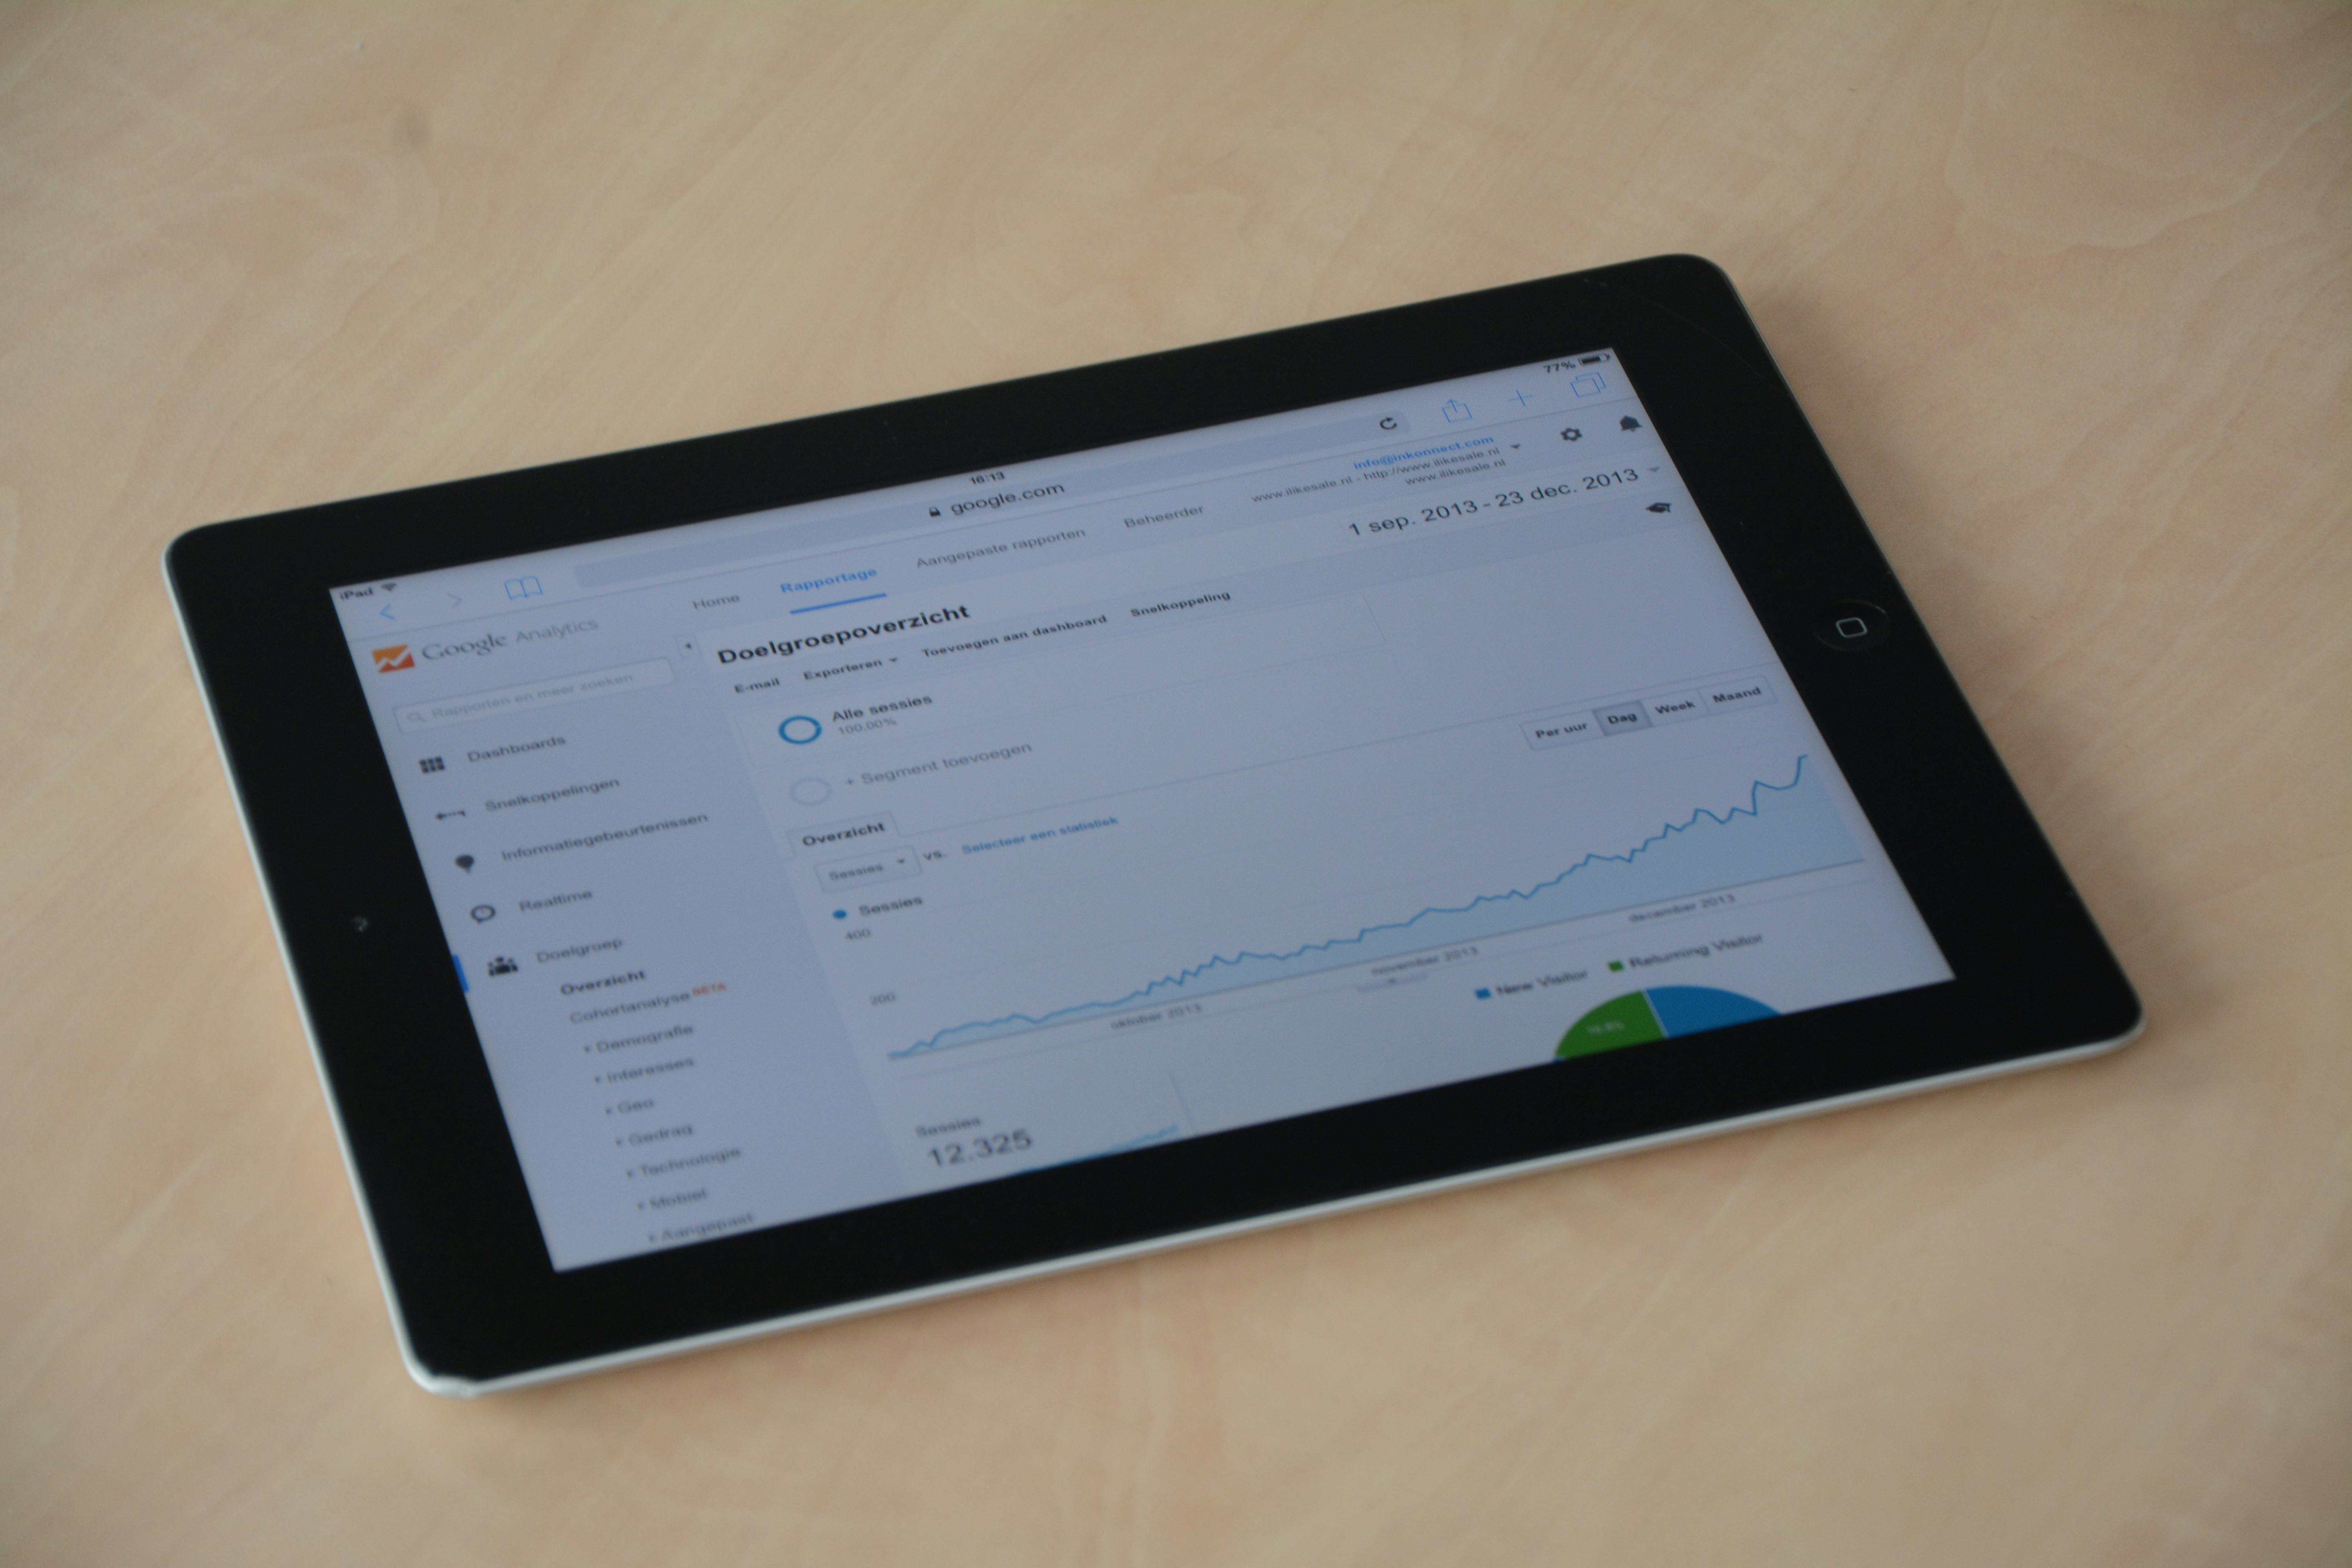
Instagram KPIs (Key Performance Indicators) are the specific, measurable metrics that connect your Instagram activity directly to real business outcomes like revenue, leads, and brand growth.
Here are the essential Instagram KPIs to track in 2026:
| KPI Category | Key Metrics to Track |
|---|---|
| Awareness | Views, Reach, Profile Visits |
| Engagement | Saves, Sends, Comments, Engagement Rate (3-6%) |
| Conversion | Clickthrough Rate, Conversion Rate, Sales Generated |
| Growth | Follower Growth Rate, Reach Growth Rate |
| Retention | Story Completion Rate, Video Watch Time |
Instagram now has over 1.22 billion active monthly users, and the average brand's organic post reaches just 4% of its followers. That gap between posting and actually being seen is exactly why tracking the right KPIs matters so much.
Most businesses make the mistake of measuring what feels good, like follower counts and raw likes, rather than what drives growth. A metric only becomes a KPI when it is tied to a specific business goal, like increasing website traffic by 15% or reducing cost per lead.
In 2026, Instagram has also shifted its primary metric from impressions to a universal "views" standard across all content formats. This changes how you should read your reports and which numbers deserve your attention each week.
I'm Kerry Anderson, co-founder of RankingCo and a digital marketing strategist with over 15 years of experience helping businesses turn Instagram KPI data into measurable revenue growth. I'll walk you through exactly which metrics to prioritise and how to act on them.
Must-know terms:
The Essential Instagram KPI Categories for 2026
Instagram KPIs are the specific measurements used to track progress toward business objectives like brand awareness or revenue growth. In 2026, the focus has shifted from simple popularity to deep attention and intent signals.
We categorize these metrics into four main buckets: awareness, engagement, conversion, and retention. By organizing your data this way, you can see exactly where your marketing funnel is leaking. If your views are high but your saves are low, your content might be reaching people but failing to provide lasting value.
Tracking Awareness
The primary metric for awareness is now views, which has replaced impressions and plays across all content formats. This universal metric measures how many times your content appeared on a screen to ensure consistent reporting across Reels and static posts.
Instagram made this shift to simplify how we measure reach. A view is counted whenever a Reel starts or a static post appears on a user's screen. This update helps us compare the performance of a carousel post directly against a Reel without jumping between different data sets.
While views tell us the total volume of exposure, reach growth rate is the Instagram KPI that measures how many new unique accounts are seeing your brand. We calculate this by taking your total reach for the month and comparing it to the previous month. If your reach is stagnant, your content is likely only circulating among your existing followers.
To expand your visibility, we focus on "unconnected reach." This refers to users who do not follow you but discover your content through the Explore page or the Reels tab. Tracking the percentage of non-followers reached is a vital indicator of how well the algorithm is promoting your brand to new potential customers.
Measuring Engagement Beyond Vanity Metrics
High value engagement is defined by saves and sends rather than public likes or follower counts. These actions signal to the algorithm that your content is worth revisiting or sharing privately, which significantly boosts organic distribution.
Likes are essentially a "low effort" interaction. In 2026, the algorithm prioritises saves because they indicate that a user found the content useful enough to keep for later. We view saves as a form of "digital bookmarking" that moves a user closer to the consideration phase of the buyer journey.
Sends, or shares, are equally critical because they represent "dark social" activity. When a user sends your post to a friend via DM, it acts as a personal recommendation. This is one of the strongest signals for virality. If your "Sends per Reach" is high, the algorithm is much more likely to push your content to a wider audience.
We recommend tracking your engagement rate using a formula that includes these high value actions. The standard formula we use is: (Total Likes + Comments + Saves + Shares) / Total Reach x 100. A healthy engagement rate for most industries falls between 3% and 6%. If you are consistently below this, it may be time to audit your social media profile success.
Aligning Your Instagram KPI with Revenue and ROI
The most critical indicators of success are conversion rates and sales generated directly from the platform. Tracking website traffic through UTM parameters allows businesses to attribute revenue to specific campaigns and justify marketing spend.
For many of our clients in Sydney and Melbourne, the end goal isn't just "likes," it is leads. We track the Clickthrough Rate (CTR) on your bio link and Story links to see how many users are actually leaving Instagram to visit your site. This is where we bridge the gap between social media and ecommerce SEO.
If you are running Instagram ads, we look closely at the Cost Per Lead (CPL) and Return on Ad Spend (ROAS). In 2026, over 40% of consumers make purchases directly through social platforms. This makes tracking "Sales Generated" a mandatory KPI for any brand with a physical or digital product.
We also monitor "referral traffic" in Google Analytics. By using specific tracking codes, we can see if a customer who clicked a link in a Reel eventually made a purchase three days later. This level of attribution is what allows us to prove the real ROI of your social media efforts to stakeholders and business owners.
How to Optimise Performance and Report Results
Performance optimisation starts with choosing the right account type and setting realistic benchmarks. For businesses, an Instagram Business account is essential because it provides access to the API, allowing for deeper data analysis through third party tools.
| Account Type | Key Features for KPIs | Best For |
|---|---|---|
| Personal | Basic likes and comments only | Individuals/Private use |
| Creator | Growth insights, daily follower data | Influencers and public figures |
| Business | API access, ad management, contact buttons | Brands and local businesses |
We suggest reviewing your KPIs on a monthly basis. This frequency is high enough to spot trends but low enough to avoid reacting to daily fluctuations in the algorithm. A quarterly strategy review is then used to adjust your social media KPI benchmarks based on long term performance.
Best Practices for Native and Third-Party Tracking
Native tracking is best handled through the Professional Dashboard in the Instagram app for real time insights. For deeper historical data and cross channel reporting, professional tools provide the context needed for executive level decisions.
The native Instagram Insights tool is excellent for a quick check on how a specific post performed. You can see reach, engagement, and profile visits for the last 90 days. However, it lacks the ability to export long term data or compare your performance against competitors in your specific region, like the Central Coast or Auckland.
For our clients, we often use third party reporting dashboards. These tools allow us to aggregate data from Instagram, Google Ads, and your website into one view. This "full funnel" reporting shows how a single KPI like "profile visits" eventually converts into a "lead" on your website.
Automation is your friend here. Instead of manually copying numbers into a spreadsheet, we set up automated reports that land in your inbox every Monday. This ensures that the data is consistent and that no one is "cherry picking" the best looking numbers to hide poor performance.
Improving High-Priority Metrics for Business Growth
Improving reach and engagement requires a focus on Reels retention and Story completion rates. Content that keeps users on the platform for longer durations is prioritised by the algorithm and leads to higher brand recall.
With Reels now supporting durations up to 20 minutes, the binary "completion rate" is less important than "average watch time." If someone watches 3 minutes of a 10 minute video, that is a massive win. We use retention graphs to see exactly where people stop watching. If there is a sharp drop in the first 3 seconds, your "hook" needs work.
For Instagram Stories, we track the "Exit Rate" and "Completion Rate." If users are consistently dropping off after the second slide, your Stories might be too long or lack engagement. Using interactive stickers like polls or quizzes can boost your Story engagement and keep people tapping through to the end.
Consistency is also a major factor. Our research shows that brands that post at least 3 to 4 Stories per week see higher website visit rates. We help our clients develop "content pillars" to ensure they always have something relevant to share, whether it is a behind the scenes look at their Wellington office or a product demo in Brisbane.
Common Mistakes to Avoid in Your Strategy
A common mistake is over tracking too many metrics instead of focusing on five to eight key indicators that map to revenue. Chasing vanity metrics like raw follower numbers often leads to a disconnect between social activity and actual business growth.
Another pitfall is ignoring "dark social." As mentioned earlier, up to 84% of social sharing happens in private messages. If you only look at public comments, you are missing the majority of the conversation. We encourage brands to stop chasing likes and start looking at how many people are actually saving and sharing their work.
Inconsistent definitions can also ruin your data. Ensure everyone on your team knows the difference between reach (unique people) and impressions (total views). If you confuse these two, your reports will be inaccurate and your strategy will suffer.
At RankingCo, we believe that data should lead to action. Amber Porter and our team of specialists focus on the data that actually impacts your bottom line. We use advanced AI to analyse market trends in locations like Perth and Adelaide, ensuring your campaigns are always one step ahead of the competition.
If you are ready to turn your Instagram into a predictable growth engine, we can help. Whether you need help with lead generation or a complete social media strategy, our team is here to guide you. Contact us today to see how we can optimise your digital presence.


Share online